Published reports and testing results related to the Christchurch Wastewater Treatment Plant.
We have strategically set up hydrogen sulphide (H2S) monitors at locations around the oxidation ponds and nearby communities. These have been in place since July 2023 and the results are regularly published on this page.
We have undertaken an air monitoring programme to:
- Understand the gases contributing to the odour.
- Identify the source of these gases (across the treatment plant site).
- Measure the impact of the gases at various distances from the plant.
Our monitors measure hydrogen sulphide in parts per million (ppm). The meters continuously monitor the levels of hydrogen sulphide in the air.
Latest hydrogen sulphide levels
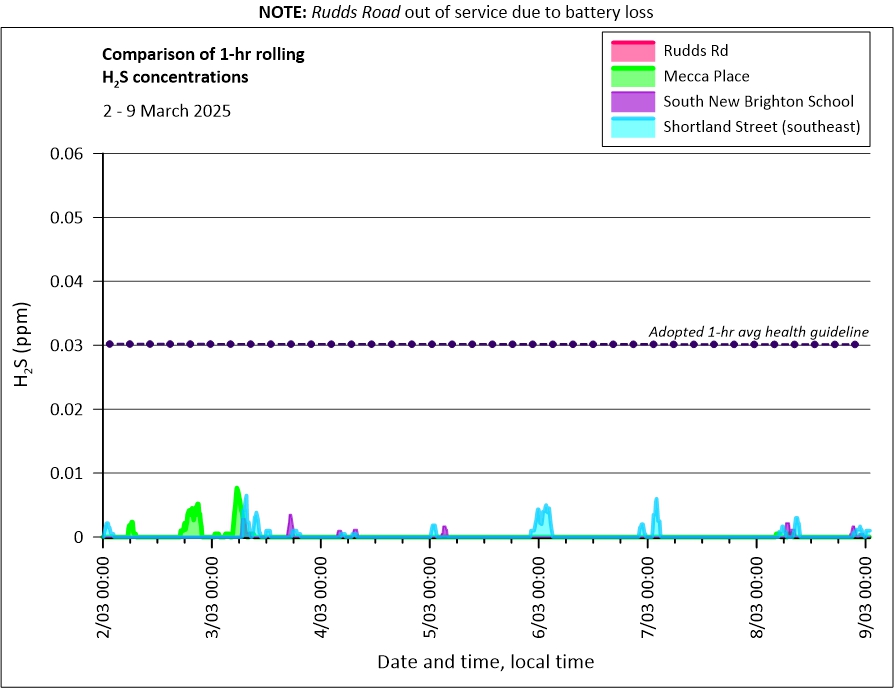
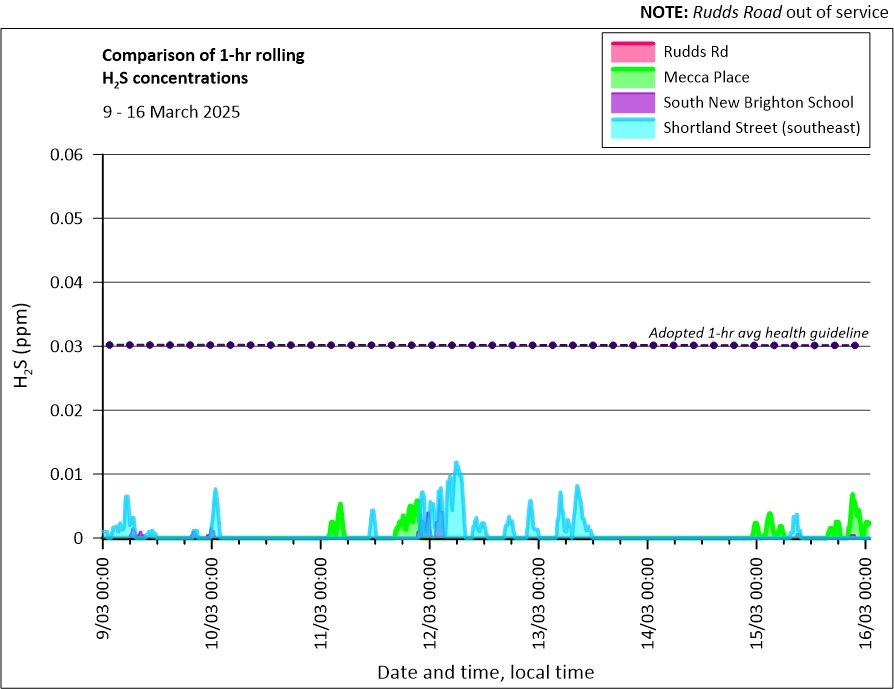
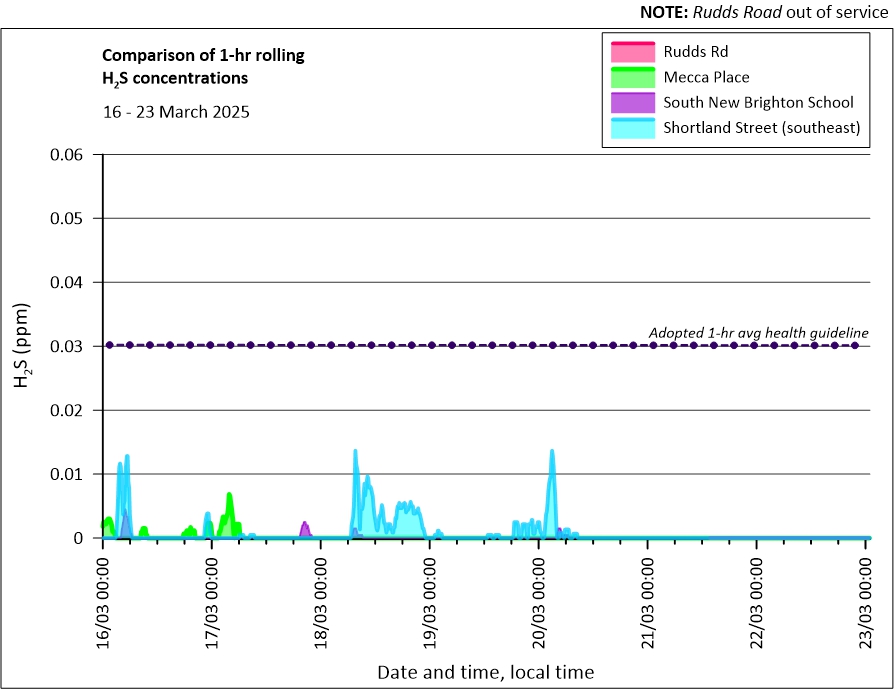
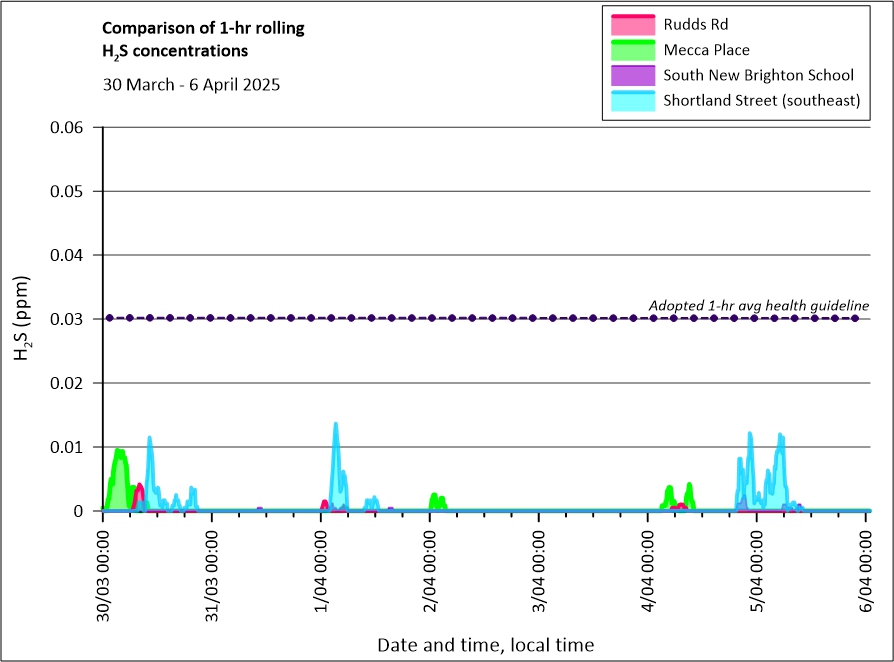
The biological health of the ponds is still fragile. Intermittent low levels of odour are being detected at community monitoring sites.
Odour and health
The odour contains a mixture of highly odorous compounds - primarily hydrogen sulphide - that are odorous at much lower concentrations than the levels that can cause adverse human health effects.
With the exception of hydrogen sulphide, the Council's community monitoring hasn't detected any odour-emitting chemicals at concentrations that could pose a risk to human health. As a result, our monitoring programme now focuses on measuring hydrogen sulphide to see if levels in nearby residential areas are in concentrations and duration to potentially cause physiological symptoms.
Hydrogen sulphide is noted for its strong and offensive odour (like rotten eggs), even at low concentrations.
The point at which people can smell, and experience symptoms from, hydrogen sulphide varies between individuals, ranging from 0.0003 to 0.016 parts per million (ppm). The Ministry for the Environment’s air quality guideline for hydrogen sulphide is 0.005 ppm. This is based on preventing odour impacts on wellbeing rather than specific health effects.
The California Office of Environmental Health Assessment sets a guideline level of 0.03 ppm (averaged over an hour) to avoid symptoms such as nausea and headaches. At this level, 83% of people will detect the gas, with 40% experiencing symptoms. These symptoms include nausea, headaches, eye and throat irritation, skin irritation, sleep disturbance and worsening asthma symptoms.
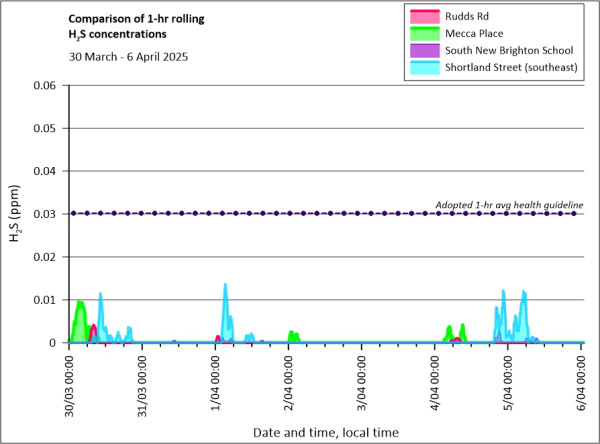
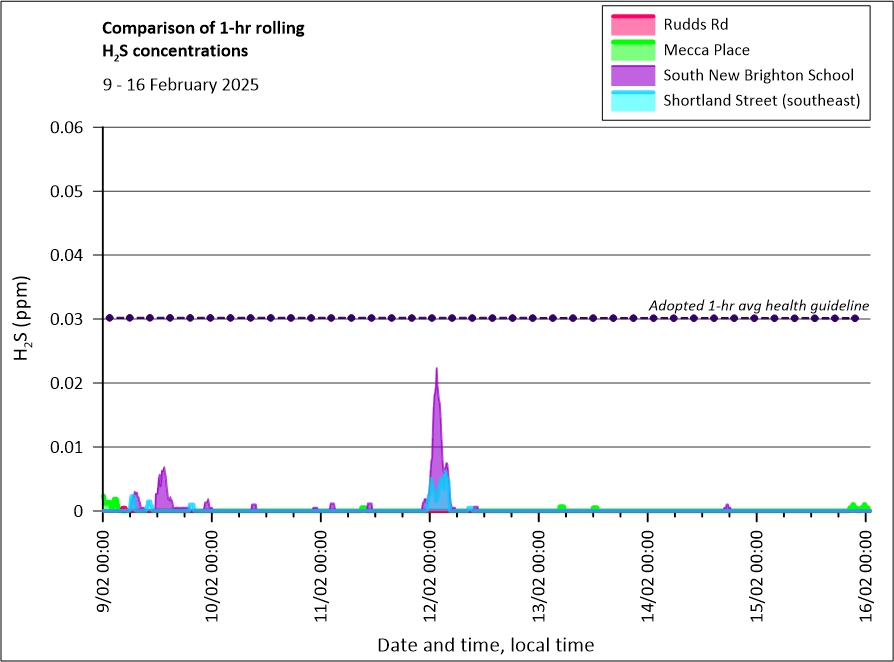
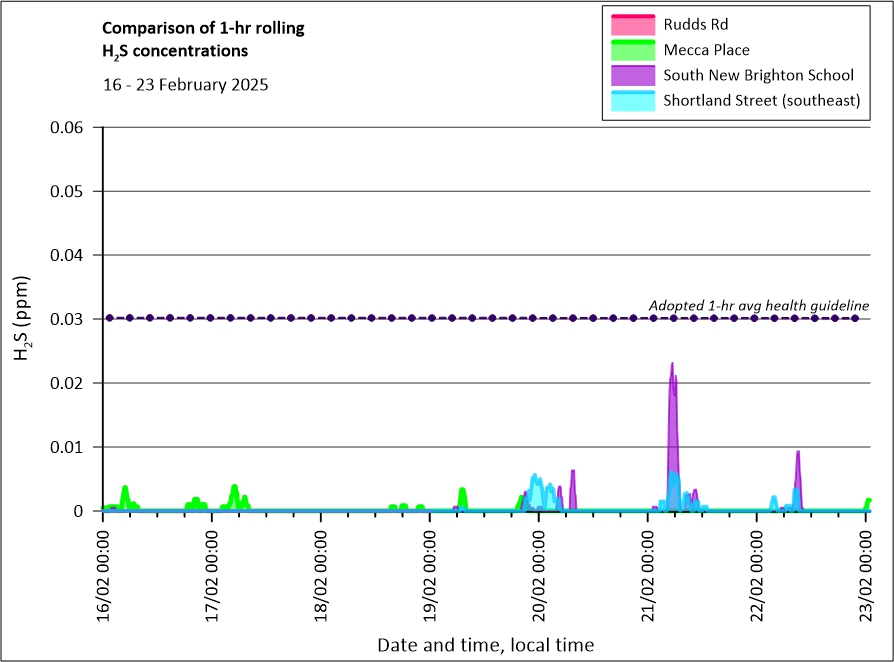
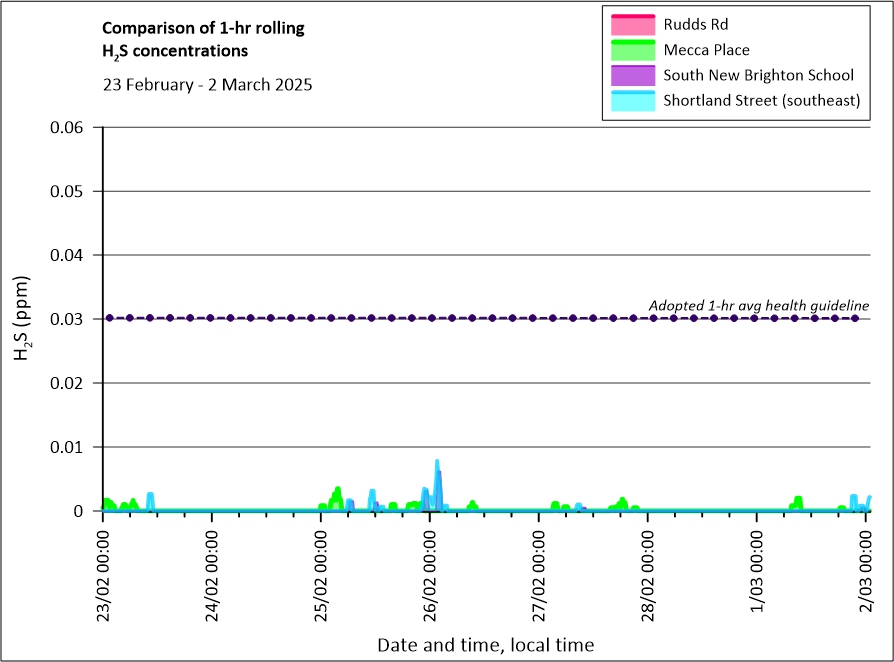
You will see on the graph a purple dotted line going across 0.03 ppm. We have adopted 0.03 ppm as the threshold for concern for impacts on community well-being. However, the variation between people means there is a wide range of responses to hydrogen sulphide. People should be guided by their own symptoms when deciding whether to seek medical advice from their GP or healthcare provider.
Where you see a spike above this it means that the levels for that hour (one spike = one hour) were higher than that. The spikes are generally caused by sustained low to moderate wind flow in the direction where the monitor is located.
While exposure to hydrogen sulphide at these concentrations is unpleasant and may result in health effects, it doesn’t accumulate in the body. Any effects would be expected to resolve when the odours are brought back to pre-fire levels, and long-term health effects are very unlikely.
Workplace standards for exposure to hydrogen sulphide are set at much higher levels to reflect the 40-hour per week exposure of a typically healthy adult population. The New Zealand Worksafe time-weighted average is five ppm (for eight-hour days and a five-day working week) and the short-term exposure limit is 10 ppm (for 15 minutes).
Previous testing results and reports
- 5 to 12 January [JPG, 79 KB]
- 12 to 19 January [JPG, 150 KB]
- 19 to 26 January [JPG, 147 KB]
- 26 January to 2 February [JPG, 147 KB]
- 2 February to 9 February [JPG, 153 KB]
- 9 February to 16 February [JPG, 142 KB]
- 16 February to 23 February [JPG, 147 KB]
- 23 February to 2 March [JPG, 142 KB]
- 2 March to 9 March [JPG, 150 KB]
- 9 March to 16 March [JPG, 155 KB]
- 16 March to 23 March [JPG, 152 KB]
- 23 March to 30 March [JPG, 143 KB]
- 30 March to 6 April [JPG, 148 KB]
January:
- 7 to 14 January [JPG, 154 KB]
- 14 to 21 January [JPG, 164 KB]
- 21 to 28 January [JPG, 160 KB]
- 28 to 4 February [JPG, 164 KB]
February:
- 4 to 11 February [JPG, 451 KB]
- 11 to 18 February [JPG, 159 KB]
- 18 to 25 February [JPG, 158 KB]
- 25 February to 3 March [JPG, 161 KB]
March:
- 3 to 10 March [JPG, 149 KB]
- 10 to 17 March [JPG, 154 KB]
- 17 to 24 March [JPG, 135 KB]
- 24 to 31 March [JPG, 167 KB]
- 31 March to 7 April [JPG, 160 KB]
April:
- 7 to 14 April [JPG, 150 KB]
- 14 to 21 April [JPG, 143 KB]
- 21 to 28 April [JPG, 145 KB]
- 28 April to 5 May [JPG, 141 KB]
May:
- 5 to 12 May [JPG, 137 KB]
- 12 to 19 May [JPG, 144 KB]
- 26 May to 2 June [JPG, 140 KB]
June:
- 2 to 9 June [JPG, 135 KB]
- 9 to 16 June [JPG, 134 KB]
- 16 to 23 June [JPG, 132 KB]
- 23 to 30 June [JPG, 132 KB]
- 30 June to 8 July [JPG, 134 KB]
July:
- 7 to 14 July [JPG, 130 KB]
- 14 to 21 July [JPG, 130 KB]
- 21 to 28 July [JPG, 131 KB]
- 28 July to 4 August [JPG, 132 KB]
August:
- 4 to 11 August [JPG, 130 KB]
- 11 to 18 August [JPG, 47 KB]
- 18 to 25 August [JPG, 46 KB]
- 25 August to 1 September [JPG, 141 KB]
September:
- 1 to 8 September [JPG, 140 KB]
- 8 to 15 September [JPG, 139 KB]
- 15 to 22 September [JPG, 138 KB]
- 22 to 29 September [JPG, 140 KB]
- 29 September to 6 October [JPG, 140 KB]
October:
- 6 to 13 October [JPG, 139 KB]
- 13 to 20 October [JPG, 136 KB]
- 20 to 27 October [JPG, 145 KB]
- 27 October to 3 November [JPG, 143 KB]
November
- 3 to 10 November [JPG, 138 KB]
- 10 to 17 November [JPG, 139 KB]
- 17 to 24 November [JPG, 142 KB]
- 24 November to 1 December [JPG, 145 KB]
December
- 1 to 8 December [JPG, 151 KB]
- 8 to 15 December [JPG, 166 KB]
- 15 to 22 December [JPG, 149 KB]
- 22 to 29 December [JPG, 151 KB]
- 29 December 2024 to 5 January 2025 [JPG, 148 KB]
Combined air monitoring results
- 24 to 31 December 2023 [JPG, 150 KB]
- 17 to 24 December 2023 [JPG, 145 KB]
- 10 to 17 December 2023 [PNG, 108 KB]
- 3 to 10 December 2023 [JPG, 159 KB]
- 26 November to 3 December 2023 [JPG, 131 KB]
- 19 to 26 November 2023 [JPG, 130 KB]
- 12 to 19 November 2023 [JPG, 135 KB]
- 5 to 12 November 2023 [JPG, 136 KB]
- 29 October to 5 November 2023 [JPG, 93 KB]
- 22 to 29 October 2023 [JPG, 136 KB]
- 15 to 22 October 2023 [JPG, 135 KB]
- 8 to 15 October 2023 [JPG, 140 KB]
- 1 to 8 October 2023 [JPG, 135 KB]
- 24 September to 1 October 2023 [JPG, 134 KB]
- 17 to 24 September 2023 [JPG, 351 KB]
- 10 to 17 September 2023 [JPG, 134 KB]
- 3 to 10 September 2023 [JPG, 133 KB]
- 27 August to 3 September 2023 [JPG, 136 KB]
- 20-27 August 2023 [JPG, 132 KB]
- 13 to 20 August 2023 [JPG, 131 KB]
- 6 to 13 August 2023 [JPG, 131 KB]
- 30 July to 6 August 2023 [JPG, 131 KB]
- 23-30 July 2023 [JPG, 139 KB]
- 16 to 23 July 2023 [JPG, 137 KB]
- 9 to 16 July 2023 [JPG, 349 KB]
- 2 to 9 July 2023 [JPG, 363 KB]
- 25 June to 2 July 2023 [JPG, 398 KB]
- 18 to 25 June 2023 [JPG, 341 KB]
- 11 to 18 June 2023 [JPG, 364 KB]
- 4 to 11 June 2023 [JPG, 362 KB]
- 29 May to 4 June 2023 [JPG, 388 KB]
- 21 to 29 May 2023 [JPG, 386 KB]
- 14 to 21 May 2023 [JPG, 322 KB]
- 7 to 14 May 2023 [JPG, 372 KB]
- 30 April to 7 May 2023 [JPG, 369 KB]
- 16 to 23 April 2023 [JPG, 349 KB]
- 9 to 16 April 2023 [JPG, 348 KB]
- 2 to 9 April 2023 [JPG, 343 KB]
- 26 March to 2 April 2023 [JPG, 336 KB]
- 19 to 26 March 2023 [JPG, 336 KB]
- 12 to 19 March 2023 [JPG, 340 KB]
- 5 to 12 March 2023 [JPG, 343 KB]
- 26 February to 5 March 2023 [JPG, 337 KB]
- 19 to 26 February 2023 [JPG, 350 KB]
- 12 to 19 February 2023 [JPG, 349 KB]
- 5 February to 12 February 2023 [JPG, 368 KB]
- 30 January to 5 February 2023 [JPG, 197 KB]
- 18 to 30 January 2023 [JPG, 220 KB]
- 1 to 18 January 2023 [JPG, 240 KB]
Combined air monitoring results
- 28 October to 11 November 2022 [JPG, 220 KB]
- 14 to 27 October 2022 [JPG, 64 KB]
- 30 September to 14 October 2022 [JPG, 713 KB]
- 23 September to 7 October 2022 [JPG, 761 KB]
- 16 to 30 September 2022 [JPG, 768 KB]
- 9 to 23 September 2022 [JPG, 743 KB]
- 2 to 16 September 2022 [JPG, 847 KB]
- 26 August to 9 September 2022 [JPG, 951 KB]
- 19 August to 2 September 2022 [JPG, 1020 KB]
- 12 August to 25 August 2022 [JPG, 1013 KB]
- 5 August to 19 August 2022 [JPG, 906 KB]
- 29 July to 12 August 2022 [JPG, 726 KB]
- 22 July to 5 August 2022 [JPG, 782 KB]
- 15 to 29 July 2022 [JPG, 882 KB]
- 8 to 22 July 2022 [JPG, 862 KB]
- 1 to 14 July 2022 [JPG, 270 KB]
Bromley School air monitoring results
- 28 October to 10 November 2022 [JPG, 196 KB]
- 14 to 27 October 2022 [JPG, 56 KB]
- 30 September to 1 October 2022 [JPG, 688 KB]
- 23 September to 7 October 2022 [JPG, 700 KB]
- 23 to 30 September 2022 [JPG, 698 KB]
- 9 to 23 September 2022 [JPG, 665 KB]
- 2 to 16 September 2022 [JPG, 665 KB]
- 26 August to 9 September 2022 [JPG, 702 KB]
- 19 August to 2 September 2022 [JPG, 730 KB]
- 12 to 25 August 2022 [JPG, 701 KB]
- 5 to 19 August 2022 [JPG, 687 KB]
- 29 July to 12 August 2022 [JPG, 674 KB]
- 22 July to August 2022 [JPG, 719 KB]
- 15 to 19 July 2022 [JPG, 738 KB]
- 8 to 22 July 2022 [JPG, 696 KB]
- 1 to 7 July 2022 [JPG, 676 KB]
- 24 to 30 June 2022 [JPG, 690 KB]
- 17 to 23 June 2022 [JPG, 677 KB]
South Brighton air monitoring results
- 28 October to 10 November 2022 [JPG, 206 KB]
- 17 to 27 October 2022 [JPG, 58 KB]
- 30 September to 14 October 2022 [JPG, 659 KB]
- 23 September to 7 October 2022 [JPG, 668 KB]
- 16 to 30 September 2022 [JPG, 677 KB]
- 9 to 23 September 2022 [JPG, 686 KB]
- 2 to 16 September 2022
- 26 August to 9 September 2022 [JPG, 706 KB]
- 19 August to 2 September 2022 [JPG, 725 KB]
- 12 to 25 August 2022 [JPG, 737 KB]
- 5 to 19 August 2022 [JPG, 716 KB]
- 27 July to 12 August 2022 [JPG, 672 KB]
- 22 July to 5 August 2022 [JPG, 718 KB]
- 15 to 29 July 2022 [JPG, 755 KB]
- 8 to 22 July 2022 [JPG, 696 KB]
- 1 to 7 July 2022 [JPG, 771 KB]
- 24 to 30 June 2022 [JPG, 750 KB]
- 17 to 23 June 2022 [JPG, 758 KB]
Rudds Road air monitoring results
- 28 October to 10 November 2022 [JPG, 194 KB]
- 14 to 27 October 2022 [JPG, 57 KB]
- 30 September to 14 October 2022 [JPG, 643 KB]
- 23 September to 7 October 2022 [JPG, 650 KB]
- 16 to 30 September 2022 [JPG, 660 KB]
- 9 to 23 September 2022 [JPG, 664 KB]
- 2 to 16 September 2022 [JPG, 681 KB]
- 26 August to 9 September 2022 [JPG, 714 KB]
- 19 August to 2 September 2022 [JPG, 746 KB]
- 12 August to 25 August 2022 [JPG, 732 KB]
- 5 August to 19 August 2022 [JPG, 696 KB]
- 29 July to 12 August 2022 [JPG, 656 KB]
- 22 July to 5 August 2022 [JPG, 724 KB]
- 15 to 29 July 2022 [JPG, 744 KB]
- 8 to 22 July 2022 [JPG, 698 KB]
- 1 to 7 July 2022 [JPG, 749 KB]
- 24 to 30 June 2022 [JPG, 798 KB]
- 17 to 23 June 2022 [JPG, 713 KB]
Shortland Street air monitoring results
- 28 October to 10 November 2022 [JPG, 208 KB]
- 14 to 27 October 2022 [JPG, 57 KB]
- 30 September to 14 October 2022 [JPG, 655 KB]
- 23 September to 7 October 2022 [JPG, 664 KB]
- 16 to 30 September 2022 [JPG, 672 KB]
- 9 to 23 September 2022 [JPG, 675 KB]
- 2 to 16 September 2022 [JPG, 758 KB]
- 26 August to 9 September 2022 [JPG, 823 KB]
- 19 August to 2 September 2022 [JPG, 853 KB]
- 12 to 25 August 2022 [JPG, 848 KB]
- 5 to 19 August 2022 [JPG, 786 KB]
- 29 July to 12 August 2022 [JPG, 724 KB]
- 22 July to 5 August 2022 [JPG, 759 KB]
- 15 to 28 July 2022 [JPG, 805 KB]
- 8 to 22 July 2022 [JPG, 734 KB]
Estuary Road South air monitoring results
- 12 to 25 August 2022 [JPG, 727 KB]
- 5 to 19 August 2022 [JPG, 697 KB]
- 29 July to 11 August 2022 [JPG, 667 KB]
- 22 July to 5 August 2022 [JPG, 712 KB]
- 15 to 29 July 2022 [JPG, 725 KB]
- 8 to 22 July 2022 [JPG, 683 KB]
Maces Road air monitoring results
- 12 to 25 August 2022 [JPG, 676 KB]
- 5 to 19 August 2022 [JPG, 665 KB]
- 29 July to 12 August 2022 [JPG, 655 KB]
- 22 July to 5 August 2022 [JPG, 705 KB]
- 15 to 29 July 2022 [JPG, 734 KB]
- 8 to 22 July 2022 [JPG, 676 KB]
House testing results: August 2022
House discolouration investigation and findings.
Christchurch City Council has received and published the findings of the houses tested for paint discolouration. Read the report [PDF, 4.2 MB].
All houses tested were found to have had lead-based paint, with almost two-thirds showing a likely reaction between hydrogen sulphide and lead in the paint.
The remaining houses didn’t show a chemical reaction, but our expert contractors, ENGEO, noted the discolouration could be removed by washing it with a chlorine solution, as the discolouration is most likely related to mould. This mould isn’t connected to the odour from the wastewater treatment plant, but is probably mould normally found on houses.
We have been advised that the discolouration is likely to only be temporary, and a 1966 study into the effects of hydrogen sulphide on lead-based paint does not suggest permanent damage to the paint.
The discolouration is expected to gradually reduce as daylight hours lengthen, the health of the oxidation ponds improves, and we progress through spring and summer.
Any discolouration under the eaves could take longer to fade as it won’t receive direct sunlight.
What you can do if your house is affected:
- We expect the discolouration to fade as the health of the oxidation ponds improves, hydrogen sulphide levels drop and daylight hours lengthen.
- Read the report findings and information.
- Wash your walls with a commercial chlorine-based solution, or warm, soapy water. This could help remove any organic dust, common moulds and some discolouration. The presence of these common moulds is not linked to the wastewater treatment plant fire.
- Adhere to the manufacturers’ proprietary ratio recommendations if you use a commercial chlorine-based solution.
- Wash your house several times if required.
- If you're physically unable to clean your house or require assistance, we can provide advice and arrange help. Contact us at wastewater@ccc.govt.nz.
What you should not do:
- Use a high-pressure washer to try and clean any staining or discolouration, as this could result in flakes of lead-based paint entering the environment.
- Exceed the manufacturer’s proprietary ratio recommendations if you use a commercial chlorine-based solution.
A mail-out containing the above information and updates from the treatment plant site, and health information will be delivered to 6,700 homes – including South New Brighton and Southshore – from Friday. Due to the distribution area, some residents might not receive this mail-out until Monday.
House testing results: June 2022
We've received our test results of the four houses that we sampled after concerns were raised about a black mould appearing on the exterior of some buildings near the wastewater treatment plant.
The results from a reputable external contractor have confirmed that the discolouration observed isn't due to mould. While sampling did detect the presence of various mould types, there were no spores or types outside of common mould that typically grows on the exterior of Canterbury houses.
We're undertaking further investigations to determine what's causing the discolouration of external paint that some residents have reported. We will publish and share these results once we receive them.
Initial air quality testing results
- 8 June 2022 [PDF, 649 KB]
- 3 June commentary 2022 [PDF, 407 KB]
- 3 June 2022 [PDF, 245 KB]
- 24 May 2022 [PDF, 690 KB]
- 18 May 2022 [PDF, 426 KB]
- 12 May 2022 [PDF, 210 KB]
- 25 April 2022 [PDF, 1.3 MB]
